“The polls are wrong!”
Typically, this is one of the last exaltations of a losing campaign. As failing campaigns close, candidates, staffers, and all involved will do anything to convince voters that the polls aren’t exposing their weaknesses but instead are hiding their pending victory. This repetitious pattern usually works . . . until it doesn’t.
We don’t tend to remember the general reliability of polls in predicting the winner. We think about how Dewey didn’t defeat Truman. Or more recently, when Trump walked off the stage in Michigan in 2016 and stated to his staff, “This doesn’t feel like second place.”[i] And it wasn’t second place despite the seeming inevitability of Hillary Clinton.[ii]
These instances prove that “The polls are wrong!” will always be a viable argument for some. It also reflects the outsized impact polls have on election discourse, which can unfortunately motivate or demotivate voters.
For context, I have always defended the polls. Even after 2016 I’d discuss with people how to read polls as well as the statistics surrounding them, such as, margin of error. I would further contextualize the polls by explaining the impact that a poll’s sponsor can have.
I never wanted people to hang too much on the polls, but my typical thinking was, “The polls are the polls! And if there is a systemic error we won’t know until the election is over.” Also, as you can tell from the “Can Biden Win?” and “Will Kamala Harris Win?” posts, I never suggest understanding election dynamics by reading polls alone. This is why I’ve provided a 2024 Election Scorecard. Polls are always just one piece of evidence to explain which way an election might be going.
However, in this presidential election cycle, we have a problem. I defended the polling industry in 2016 and 2020 because I believed in the assumption that the pollsters’ main goal was to accurately measure public sentiment and call elections correctly. I didn’t want to besmirch the industry for any individual’s reliance or misinterpretation of the survey data.
With this year’s Presidential election, the pollsters’ main mission is to not underestimate Trump’s support. Simply put, this isn’t necessarily a bad starting point for accurately capturing public sentiment. I don’t think they are being nefarious, but I do think their methodology and experience from prior Trump elections are making them myopic. And this pollster myopia risks making the public discourse myopic as well.
In this post, we’ll examine how we got here by looking briefly at the evolution of public opinion research, how the pollsters are taking measures to not underestimate Trump, the impact of those methods on the polls and the discourse, the credibility surrounding current election, and finally how this all plays into predictions for the election’s outcome.
Buckle up. This is going to be an interesting ride.
The Role and Evolution of Public Opinion Research:
We’re always trying to read the minds of the public. However, it is impossible to get perfect data by asking for everyone’s individual opinion. To fix this, statisticians use a sample of the population to estimate public opinion at a reasonable confidence level with a reasonable margin of error. Using sampling data generally is a very old practice.[iii]
The use of public opinion research in U.S. politics is significantly more recent than that. In 1932, Dr. George Gallup was a journalism professor and the head of marketing and copy research at Young and Rubicam, a New York advertising firm.[iv] That year, Iowa Democrat Ola Babcock Miller, Gallup’s mother-in-law, was running to be Iowa Secretary of State.[v] Gallup put his skills to work to help get Miller elected, which marked his first foray into election polling and forecasting.[vi]
In 1935, Gallup formed the American Institute of Public Opinion, which today is Gallup, Inc.[vii] In 1936, Gallup made his mark and changed U.S. political punditry when he accurately predicted President Franklin Roosevelt’s victory over Gov. Alfred Landon.[viii] Prior to this election, The Literary Digest had the most reputable election poll[ix] because they sourced poll respondents from their readers and other publicly available data like phone numbers, drivers’ registration, and country club memberships.[x] This did not yield a representative sample, and the Literary Digest poll suffered from a low response rate.[xi] The magazine predicted that Landon would win 57%-43%, but Roosevelt won 62%-37%.[xii] Gallup’s approach used a broader cross-section of the voter base as a sample, which gave him the insight needed to call the race correctly.[xiii] The Gallup Poll became a household name after this, and “The Literary Digest ‘lost face’ and later went out of business.”[xiv]
Yet Gallup isn’t without his stumbles either. In 1948, the Gallup Poll predicted that Gov. Thomas Dewey would easily win the presidential election over President Harry Truman.[xv] Welp . . .
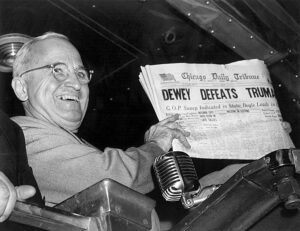
I don’t think President Truman is smiling about his upcoming early retirement in that photo.
Gallup had stopped polling the race three weeks before the election and missed late breaking sentiment changes in Truman’s favor.[xvi] Gallup adjusted his methods going forward and his polling operations continued to grow.[xvii]
Gallup’s legacy continues. The number of polling firms has grown exponentially, especially between the years of 2000-2022.[xviii] Speaking anecdotally, all of this polling begot polling averages and election forecasts. Polling averages allow us to aggregate the results of different pollsters. This prevents anyone from just relying on one pollster’s judgments and methodologies. The election forecasts go a step further to include other electoral victory factors into a model that simulates potential election outcomes and assigns candidates a probability of winning.
Arguably, 538, one of the most trusted sources covering the polling industry, is the most famous election forecast. In 2008 Nate Silver accurately predicted President Obama’s victory, missing only a single state on his electoral college map.[xix] Silver’s reputation was further boosted after his model’s performance in 2012.[xx]
Personally, after 2012, I also felt like the polls were pretty locked in. Then 2016 happened. And we all watched Clinton lose to Trump while 538 gave her a 71.4% chance of winning.[xxi] This is a day that haunts Democrats, gives hope to Republicans, and puts the pollsters in a glass case of emotion.
The polls missed primarily due to a late sentiment shift away from Clinton because of James Comey’s letter and a lack of sample weighting by educational attainment.[xxii] However, the 2016 polls didn’t miss the final election margin by any special amount.[xxiii] Much like what happened in 1948 it was jarring to see the polls get the result wrong. However, the pollsters simply adjusted their methods by adding education weighting before heading off into the 2020 election.[xxiv]
Quick Detour on Poll Weighting (Feel free to skip this section if you have been comfortable with the use of statistics jargon so far):
Ok . . . Quick timeout.
If it has been a minute since you’ve had a statistics course or haven’t had the opportunity to do so yet you might be wondering why I keep talking about weighting. A consistent challenge in election polling is getting a representative sample of the electorate. Pollsters do not know exactly what the electorate will look like demographically (e.g., age, race, gender, education attainment, etc.) by Election Day, and sampling 900-1,500 random people doesn’t exactly yield the most accurate results.
This is further complicated by the concept of sampling error. College educated voters and older voters are more likely to answer polling firms,[xxv] which leaves more working-class people and minorities consistently undersampled. And just like with The Literary Digest in 1936, this can lead to erroneous results.
Pollsters will use different outreach methods like online panels, mail, and establishing respondent quotas to help address the sampling issue. However, this won’t fix everything. And as a way of getting the best results, pollsters turn to weighing the sample.
The pollsters will try to get a read on who is enthusiastic and likely to turn out to vote. They will also use demographics from past elections to get a feel for voter turnout. Pollsters will use that data to amplify the voices of the undersampled voters in the polls.
In the past, pollsters only weighed responses based on race, age, and gender.[xxvi] And although those factors are still very much in play there are now other demographic weights to consider.[xxvii] If you look at the polling document itself (not just the news article with it), pollsters often share which demographic categories are being weighed. But their exact mathematical weights and methods are closely held secrets. If you have a familiarity with calculating any weighted average, you can understand why the pollsters are relying on this tactic.[xxviii]
As we’ll see below, there are some risks in choosing what demographics to weigh and how much to weigh those demographics. The point of this diversion is to make sure we’re at the same starting point conceptually. Also, it should be noted the goal of weighting is to ensure the final poll results reflect what a representative sample of the electorate is thinking.
Back to The Role and Evolution of Public Opinion Research:
In 2020, the polls accurately predicted the outcome but had missed terribly on the margins despite the educational weighting adjustments. President Biden had defeated Trump (re-read that a few times if you need to), but not by as much as the pollsters expected. This led the American Association of Public Opinion Research (“AAPOR”) to call 2020 pre-election polls the most inaccurate polling since 1980.[xxix]
While the rest of us (or at least Biden voters like me) went on our merry way, it gnawed at the pollsters how they missed so badly. Much like it did after the 2016 election, the AAPOR formed a task force to figure out what went wrong. AAPOR’s final report ruled out polling error causes such as the lack of education weighting, incorrect electorate demographic assumptions, and late-deciding voters.[xxx] The AAPOR did highlight the lack of Republican and new voter responses in polls as potential issues.[xxxi] However, the AAPOR admitted there is a lack of data to explain exactly what happened.[xxxii] Since this creation of the report, pollsters are determined not to underestimate Trump for a third time.
In 2022, the pollsters re-tooled their methodology and had a banner year. Or at least that’s what they called it.
The pollsters predicted election margins more accurately, but the polls were historically horrendous in predicting the winner.[xxxiii] Per 538, the polls usually call the election correctly 78% of the time.[xxxiv] In 2022 it was 72%, the lowest since 1998.[xxxv] The polls only called house elections correctly only 64% of the time.[xxxvi] To give you a sense of how pollsters think about this 538 stated: “[b]ut that low hit rate doesn’t really bother us. Correct calls are a lousy way to measure polling accuracy.”[xxxvii]
I’m sure The Literary Digest wished more people thought that way.
2022 was a strange year for polls, polling averages, and election forecasts. The polls that year had been predicting a “Red Wave” that was going to bring the Republicans large majorities in the House and deliver the U.S. Senate. The Republicans gained a small House majority and failed to win the U.S. Senate.
This “Red Wave” sentiment was bolstered by Republican leaning partisan polls that were flooding the polling averages and forecasts.[xxxviii] Pollsters also deployed more data collection methods, applied learnings from the 2020 voter turnout data, and added recall vote weighting to polls. This method was used to better indicate election margins even though the polls didn’t call races as correctly as before.[xxxix]
To me, this recent history leaves the polling industry in a weird spot. Gallup built this industry on predicting elections correctly. Yet when the polls got the outcome right in 2020, the margins spooked the industry into avoiding as much election prognostication as possible. 538 now states directly on its 2024 forecast that: “[Our] forecast is based on a combination of polls and campaign “fundamentals,” such as economic conditions, state partisanship and incumbency. It’s not meant to “call” a winner, but rather to give you a sense of how likely each candidate is to win.” (emphasis added)[xl] This is a downgrade from the very prominent “Biden is favored to win the election,” forecast headline from four years ago.[xli] Adding to the 2024 weirdness, we’re also seeing another drop in high-quality polling nationally and on the state-level.[xlii] Republican polling firms are also flooding the averages and forecasts with Republican friendly polls again.[xliii]
I don’t think these dynamics are good for the public opinion industry. The public will always have a mathematical and methodological disconnect from what the polls really mean. To 538’s credit, they published a good article on how to navigate these dynamics. But generally speaking, this industry was built on accurately gauging public sentiment and calling elections correctly. This is what the public expects from its polls, which can alleviate election anxiety. It also helps impact their motivation to vote, volunteer, or fundraise. Maybe the polls should not have this special station in the election discourse. But they do, and the pollsters should try to live up to it better.
That said, the polling industry is not going to do that between now and Election Day. This is a systemic problem that pollsters have created by underestimating Trump. . . twice. If we’re going to get anything out of reading this information, we need to know more about how the pollsters are avoiding underestimating Trump, in the next section that I have simply titled:
How the Pollsters Are Avoiding Underestimating Trump . . . Again:
Pollsters are doing a lot of things to avoid missing potentially unidentified Trump support. They don’t all have the same approach. You need to read the methodology of each poll to gain some understanding of what that particular pollster is doing. If there is a common theme the pollsters, even the highly rated pollsters, are interjecting more of their own judgment calls because they can’t afford a threepeat of missing Trump supporters in poll results.
On a high-level, the pollsters are doing three things to keep from underestimating Trump. First, they are trying to get more Trump supporters to avoid sampling errors. Next, pollsters are weighing Trump supporters, or those who fit the profile, more in the poll results. And finally, pollsters are adjusting their likely voter models. Let’s discuss how each of these options might play out.
Sampling Changes
If the polls in 2016 and 2020 failed to sample Trump supporters, then the polling results would show too much strength for Democrats. As mentioned above, it is hard to get non-college educated and working-class people to respond to polls. Therefore, a reasonable mitigation is to get more of these folks in the sample size.
Oversampling Trump supporters is the big risk here. If pollsters oversample, they’ll change the underlying sentiment of the poll and make it too Republican leaning. This is what The Literary Digest did back in 1936 even on a 2.4M respondent sample size.
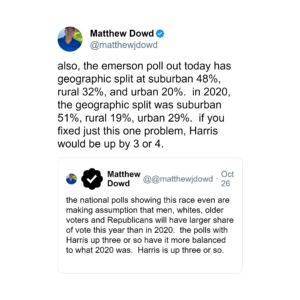
Matthew Dowd, former chief strategist for George W. Bush, suggests this oversampling is occurring in polls currently.
“[T]he national polls showing this race even are making assumption that men, whites, older voters and Republicans will have a larger share of the vote this year than in 2020. [T]he polls with Harrs up three or so have more balance to what 2022 was. Harris is up three or so.”[xliv]
Dowd doubled down on this assertion in another tweet responding to an Emerson poll showing a 49-49 race with an unlikely geographic split. The Emerson poll suggests that 32% of the electorate will be rural voters when it was only 19% last time.[xlv]
Weighting Changes
Ah . . . our old friend, weighting.
Weighting changes are arguably the most controversial pollster adjustment this year. As mentioned above, pollsters have added more weighting categories in recent years to bring their surveys in line with prior election results. However, the whole exercise adds more judgment to the process.
Recall vote (or past vote in some pollsters’ terminology) is the most debated weight category in this election cycle.[xlvi] With recall vote weighting, the pollster asks the respondents who they voted for in the last election.[xlvii] Then based on that response, the pollsters weigh those responses “to match the outcome of the last election.”[xlviii]
This approach had been highly disfavored because (believe it or not) people tend to forget who they voted for, claim they voted for the winner when they didn’t, or said they voted when they didn’t.[xlix] Per Nate Cohn, lead pollster for the New York Times: “the tendency for recall vote to overstate the winner of the last election means that weighting on recall vote has a predictable effect: It increases support for the party that lost the last election.”[l]
And when you think about it that’s exactly what most pollsters are trying to do. They want to boost Trump’s poll performance to reflect the 2020 voter turnout. As of October 6th, two-thirds of pollsters were using recall vote weighting in polls.[li] Obviously Cohn’s New York Times/Siena poll doesn’t, but we’ll circle back to them in a moment.
The argument for using recall vote weights includes accounting for voters’ forgetfulness by utilizing voting records to verify their actual responses.[lii] This obviously doesn’t include who they voted for, but at least if the person voted or not. Additionally, per David Byler, chief of research at Noble Predictive Insights, “[m]any reputable pollsters say that weighting by recalled vote improved the accuracy of past surveys.”[liii] Yet, as we saw in 2022, improving on margin accuracy doesn’t necessarily lead to better predicting the actual winner.
Adding recall vote weights is just one adjustment though. Since 2016, education has been added to pollster weighting.[liv] Per Pew Research Center, metropolitan status, party affiliation, and voter registration are frequently added weights as well.[lv]
More weights also mean more judgment. Even though Cohn has rejected recall vote weights, he is weighing his polls in anticipation of an electoral realignment around education attainment as opposed to the traditional dividing lines of race and gender. This is how Nate Silver described his approach:
Cohn is convinced that other pollsters are missing a big change in the electorate, perhaps even a realignment where educational attainment and social class begin to predominate over race as the major dividing line in American politics. In that case, the map could be more scrambled from 2020 than people are expecting — or there could even be other surprises like Harris losing the popular vote but winning the Electoral College.[lvi]
Both Cohn and Silver assert that if Cohn is right Trump will gain strength in the Sun Belt (Georgia, Arizona, and North Carolina) and lose steam in the Rust Belt (Pennsylvania, Michigan, and Wisconsin). Per Cohn, “[t]he polls that don’t weight on past vote tend to show results that align more closely with the result of the 2022 midterm election than the last presidential election.”[lvii]
This is a big reason why it feels like the polls are all over the place. And this is before accounting for less reputable Republican polling firms flooding averages and election forecasts with Trump-friendly polls.
This is also before accounting for highly rated pollsters engaging in herding. Herding occurs when pollsters begin to show results consistent with polling averages in the closing weeks of a campaign.[lviii] Some observers believe that we are seeing this now.[lix]
What a mess and we still aren’t done . . .
Likely Voter Model Changes
The likely voter model is the last stop. After Labor Day pollsters begin rolling out likely voter results along with the registered voter poll results.[lx] The goal of these likely voter models is to further home in on actual electorate demographics.[lxi] Personally, I often end up playing this game with the pollsters. If I expect a high turnout, then I’ll pay attention to the registered voter polls more and vice versa.
Yet, of course, there’s a problem with that this year. The likely voter polls aren’t being their typical selves. Usually, the Democrats do better in registered voter polls, and Republicans do better in the likely voter polls.[lxii] And you might be thinking “Well . . . Patrick is just going to tell me that it is the opposite this year and move on.”
Unfortunately, it’s way worse than that. Per the Silver Bulletin, this dynamic has flipped on the national level, which has Harris doing better in likely voter than registered voter polls.[lxiii] But the state-level polls show Trump performing better in the likely voter polls.[lxiv] However, this state-level Trump advantage is not consistent across polling firms with some firms still showing a Harris likely voter advantage.[lxv] Furthermore, per the Silver Bulletin, “[i]t isn’t a quality issue. Some of our highest-rated pollsters like NYT and The Washington Post (both A+) show Harris doing better among LVs. But other high-quality pollsters like Marist and Fox News (both A) show the opposite.”[lxvi]
The Silver Bulletin’s most direct explanation for the change in this dynamic is once again pollster judgment. The article states: “likely voter screens are a place where some of the ‘art’ of polling comes in. Where pollsters can make more subjective decisions. They’re one of the factors that makes the polling situation uncertain and polling error in either direction highly plausible.”[lxvii] This art of polling in likely voter models ranges from pollsters just asking respondents if they are likely to vote to using probabilistic models to determine who are the likely voters.[lxviii] For example, the Fox News poll includes church attendance in its likely voter model.[lxix]
And while I can’t find anything directly saying that pollsters are changing their likely voter models in response to 2020’s polling margin miss, it is just one more available judgment lever to pull to prevent underestimating Trump.
Where Does This Leave Us
At this point you’re probably thinking “Why are we even looking at these things now?”
Honestly, I wouldn’t blame you if you walked away from this blog and never looked at an election poll again. But as a strategist, I can’t simply look at the confusion and say, “That’s wild!”, then walk away. I have to dig deeper for some insight that helps prepare us for the world ahead.
To do this, let’s take a step back, look at the bigger picture, and bring in other real-world elements that help us think through whether the polls are feeling real.
I think all these developments in the polling industry have left us with three distinct scenarios to think about:
The Nightmare Scenario
I’ve been “out” as a Harris voter since the last blog. So, I’m just putting this scenario in my own terms. If calling this “The Nightmare Scenario” makes me sound like a frantic Democrat in search of hopium and confirmation bias, then call this the “Trump Underestimation Scenario.”
In this scenario, the pollsters have underestimated Trump for a third time. This would lead to him picking up the Rust and Sun Belts in a landslide. This has been a concern for certain Democrats since September.[lxx]
One reason to believe this argument is Trump’s possible uptick in support from Black, Latino, and young men.[lxxi] Another reason is that pollsters have established this pattern before, which suggests they don’t know how to survey his supporters. And one last reason to believe this is because Trump traditionally (and currently) has had some strength with low propensity and low engagement voters,[lxxii] who pollsters can easily miss.
You can also argue that there might be a sentiment shift to Trump based on a Fox News poll that shows a majority reflecting fondly on his time as president.[lxxiii] But I don’t want to base too much of the argument for this scenario on the very polls we’re dissecting. That type of circular reasoning has no place on The Real Question.
Despite my title for this scenario, preservation of my mental state isn’t why I’m exercising caution about this scenario becoming a reality. My main assertion for downplaying this scenario are the differences between the 2016 and 2020 election results. On very contrasting turnout levels, Trump’s vote percentage stays about the same. It is incredibly durable and leads me to believe that this is the ceiling. This means we’ve seen his ceiling and lived through it, and this was before January 6th and 34 felony convictions (among other things).
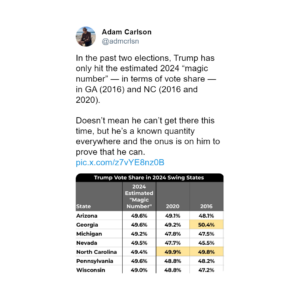
David Plouffe, a top adviser to the Harris Campaign, essentially argued the same thing on Pod Save America. Plouffe states: “[Trump’s] going to get 48% of the vote. . . we wish there was an easy pathway, but that pathway doesn’t exist.”[lxxiv]
My other argument against this scenario is for you to re-read the “How the Pollsters Are Avoiding Underestimating Trump . . . Again” section of this blog. Mathematically if you oversample Trump voters, boost those responses by weighing them (even using recall vote weighting, which was taboo years ago), and then on the state-level say Trump poll respondents are more likely to vote . . . intuitively it feels like we’d need a real black swan event or some super hidden sentiment shift in Trump’s favor for this to happen.
If this scenario plays out, then I’ll only know what happened in retrospect during what would be one of the most soul crushing election autopsies of my political life. The pollsters are truly using a sledgehammer to keep from underestimating Trump this time, and I can live with that.
The Polls Are Right Scenario
Let’s say they nailed it, and every adjustment they’ve made pays off. This means we must make sense of what the polls are showing at a high level.
In all this confusion, there seems to be some sort of coalescing around the electoral map which will either be similar to 2020, 2022, or one where Harris wins the Blue Wall but loses the popular vote. And I am literally fine with all those scenarios as a Harris supporter because all of those scenarios lead to Harris’ victory to some degree.
This is a very categorical view of things though. Some scenarios will definitely make me happier than others, and the idea of Harris losing the popular vote would make me outright concerned. But those are all victories. The 2022 map is less certain of a win because Sen. Ron Johnson (R-WI) and Gov. Brian Kemp (R-GA) won, but those concerns are somewhat offset but Democrat wins in Arizona, and Gov. Tony Evers (D-WI) and Sen. Raphael Warnock (D-GA) 2022 victories.
However, I must reconcile my confidence here with the fact that as of the time of writing, Harris is behind in 538’s, Nate Silver’s, and other election forecasts.[lxxv] These forecasts would seem to be evidence of The Nightmare Scenario as well. But, as mentioned above, there’s circular reasoning in this evidence right now.
Despite the circularity, it is still concerning to see the forecasts not in Harris’ favor right now. But the polls were not great at predicting the winners last time. This infected forecast models as well. For example, 538 gave Herschel Walker a 63% chance of winning the Georgia U.S. Senate seat, and he didn’t win on election night or the runoff.[lxxvi] 538 forecasted Kari Lake (68%) and Tim Michels (53%) to win the Arizona and Wisconsin gubernatorial races, respectively.[lxxvii] They also gave Dr. Oz a 57% chance of winning the Pennsylvania Senate seat.[lxxviii] 538 got some calls like Josh Shapiro’s Pennsylvania gubernatorial, Ron Johnson’s senatorial, and Mark Kelly’s senatorial wins correct,[lxxix] but at the time those didn’t feel like they would be hard to call. Maybe this is why 538 doesn’t want you to use their forecast for predictions anymore.
The Dream Scenario
This is my happy place. Again, if this makes me sound like a blue-colored glasses-wearing Democrat, then call this the “Harris Underestimation Scenario.”
This is the scenario where Harris performs above the polls. I’ll start with the argument against this assertion. It’s basically what you’ve heard above in “The Nightmare Scenario” and “The Polls Are Right Scenario,” regarding potential softening of support in key demographics and the pollster methods adjusting correctly.
I will add that Harris isn’t necessarily acting like a candidate who is comfortably ahead. She’s stepped up the number of events in the Blue Wall and has been on a tour of various podcasts and other media events to reach out to core demographics.[lxxx] But side note, per the Election Scorecard, wouldn’t Harris supporters want her to do that either way?
Now, I’m going to do something different here. I’m not going to lead the argument for this scenario with the typical reasons you may have heard about why Harris is gaining support. I’ll include those in a moment. And for the purposes of this piece, I’m leaving out everything pertaining to early voting.
The argument for this scenario is based on the current state of polling. Pollsters are primarily using mathematical methods to boost Trump in the polls. These methods rest on the assumption that Trump will suffer no voter defections, turnout drop, or anything else that erodes his support. It treats the Trump supporters categorically and amplifies their voices through mathematical means.
If Trump respondents’ voices are amplified, then a small shift towards him would ripple into a large shift in the polls. However, this also means an uptick in Harris’ support would be discounted to keep her poll results consistent with a close race.
Movement to Harris from the Dobbs decision, January 6th, the 34 felony convictions, Trump saying he wants generals like Hitler’s, or anything else would be tapped down. A possible gender gap in voting wouldn’t appear. We might also miss pick ups in support from low-engagement voters and new voters depending on the poll.
And this is the fundamental problem with pollsters trying to sample, weigh, and likely vote their way out of the potential issue of underestimating Trump. It broadly masks shifts in sentiment. Cohn notes this in his argument against using recall vote weighting, which when deployed moved most of his battleground state polls toward Trump.[lxxxi] Here is another example of this math issue shown by a University of Arizona professor and pollster in response to an excellent Good Authority article explaining this very issue:
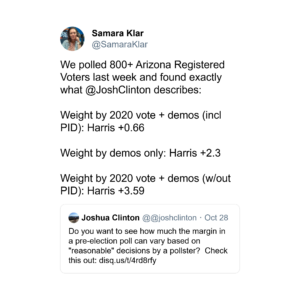
Ultimately, this means if Harris is on the verge of an electoral landslide, then we’d likely not see it coming in the published polls. Nate Silver even tweeted that if this happens we’d be in a “polls are wrong” situation.
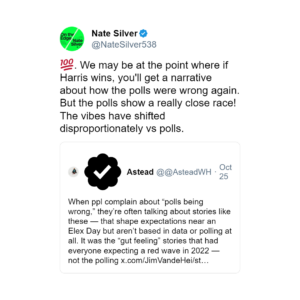
And I think that’s why you shouldn’t see my post as a Democrat grasping for straws. My argument for the Dream Scenario is plainly and functionally mathematical.
In many ways, this is like Sherlock Holmes using the dog that didn’t bark to solve the mystery in Sir Arthur Conan Doyle’s Silver Blaze.[lxxxii] In this case, Trump over performing in polls would be the barking dog, and we don’t see this happening currently (i.e., he barely hits 50% in his best polls). Therefore, we likely aren’t in the “Nightmare Scenario.” We have a chance at being in the “Polls Are Right Scenario,” but we could very easily and happily (at least for the Harris supporters) be in the “Dream Scenario”. . . and not know it. If either of the latter two scenarios are realized, Harris would have multiple paths to victory.
Therefore, I don’t have to reach into the bag of campaign hopium or partisan messaging to make this argument. I just have to understand how sampling and weighted averages work and get extremely plausible Harris arguments based on the polls.
Quick Side Note on Harris Before Concluding:
You might be thinking, “But Patrick, I’ve seen polling with her losing support in [x] demographic.” In typical polling years, where the pollsters’ aren’t driven by fears of missing on Trump’s level of support, I would be rapidly trying to figure out what happened in those demographics. But this year more than ever, I’m relying on polling that focuses on those demographics with large sample sizes, preferably focused on battleground states.
When you look at polls that fit that description, you see the electorate is shaping up more in line historically than political realignment. Voto Latino produced a poll of 2,000 Latino voters in battleground states showing a 64-31 race in favor of Harris.[lxxxiii] Howard University (yes, I know this is Harris’ alma mater) produced a poll of 981 Black voters in battleground states showing an 84-8 split in favor of Harris.[lxxxiv] A very recent NAACP Poll of 1,000 Black voters showed Harris gaining 8 points of support from Black men under 50 and Trump losing 6 points compared to the results of the same poll from September.[lxxxv] Harvard’s national youth poll with a 20-point lead among young voters, which tightens to a 9-point lead in the battleground states.[lxxxvi]
I freely admit that my argument would improve if more pollsters surveyed these communities this way. It would reduce my reliance on the individual pollsters’ methodology and overall feeling that this could be cherry-picking on my part. But I have to work with what I have.
Conclusion:
Will Kamala Harris win? At this point, I’m in the camp with David Plouffe, Sen. Brian Schatz (D-HI),[lxxxvii] and other Democrats I have seen or heard in passing. If the work is put in and Harris supporters get out and vote, she should win. At the time of this writing, Harris seems to be doing everything she can to make that happen.
If I make an official prediction, I won’t publish it before Election Day. I just need more time to see how the early vote comes in and do more thinking on each candidate’s ground game and fundraising. Strategically speaking, I’d rather be Harris than Trump in this situation, which is not a conclusion you’d gather with a passive look at the polls.
But I’ll end with this: If you are a Harris supporter reading this blog and you’re anxious about this election, then you need to vote. And then get the Harris-leaning people around you to vote today. The outcome of this election is truly in your hands, and I don’t want you to wait for the pundits, pollsters, or influencers to tell you that she’ll win before you decide to act. Turn your fears and anxieties into actions and vote today!
Endnotes:
[i] https://www.politico.com/story/2016/12/michigan-hillary-clinton-trump-232547
[ii] https://projects.fivethirtyeight.com/2016-election-forecast/
[iii]Bethlehem, Jelke. The Rise of Survey Sampling. Discussion Paper. Statistics Netherlands. 2009.
[iv] https://www.gallup.com/corporate/178136/george-gallup.aspx
[v] See note iv and https://www.idpwomenscaucus.com/ola-babcock-miller/
[vi] See note iv.
[vii] See note iv.
[viii] See note iv.
[ix] https://youtu.be/Jpob_WQ3CQQ?feature=shared (Business Insider, How Can Polls Actually Be Getting Better?)
[x] See note ix.
[xi] https://mathcenter.oxford.emory.edu/site/math117/historicalBlunders/
[xii] See note xi.
[xiii] See note ix.
[xiv] See note iv and xi.
[xv] https://ropercenter.cornell.edu/pioneers-polling/george-gallup
[xvi] See note xv.
[xvii] See note xv.
[xviii] https://www.pewresearch.org/methods/2023/04/19/how-public-polling-has-changed-in-the-21st-century/ ; https://www.youtube.com/shorts/PPkIJYmXpm4
[xix] See note ix.
[xx] https://money.cnn.com/2012/11/07/news/companies/nate-silver-election/index.html
[xxi] https://projects.fivethirtyeight.com/2016-election-forecast/
[xxii] https://asktherealquestion.com/2020-presidential-election-prediction/#_edn6
[xxiii] https://fivethirtyeight.com/features/the-polls-werent-great-but-thats-pretty-normal/
[xxiv] https://www.cbsnews.com/news/2016-polls-president-trump-clinton-what-went-wrong/
[xxv] https://www.youtube.com/shorts/lKw7CvL3D9Y (Pew Research Center Short on Weights)
[xxvi] See note xxv.
[xxvii] See note xxv.
[xxviii] https://www.restore.ac.uk/PEAS/theoryweighting.php
[xxix] https://news.vanderbilt.edu/2021/07/19/pre-election-polls-in-2020-had-the-largest-errors-in-40-years/
[xxx] https://aapor.org/wp-content/uploads/2022/11/AAPOR-Task-Force-on-2020-Pre-Election-Polling_Report-FNL.pdf
[xxxi] See note xxx.
[xxxii] See note xxx.
[xxxiii] https://fivethirtyeight.com/features/2022-election-polling-accuracy/
[xxxiv] See note xxxiii.
[xxxv] See note xxxiii.
[xxxvi] See note xxxiii.
[xxxvii] See note xxxiii.
[xxxviii] https://www.nytimes.com/2022/12/31/us/politics/polling-election-2022-red-wave.html
[xxxix] https://www.nytimes.com/2024/10/23/upshot/poll-changes-2024-trump.html
[xl] https://projects.fivethirtyeight.com/2024-election-forecast/
[xli] https://projects.fivethirtyeight.com/2020-election-forecast/
[xlii]https://www.politico.com/live-updates/2024/10/20/2024-elections-live-coverage-updates-analysis/polls-trump-harris-00184538 ; See note xxviii.
[xliii] https://newrepublic.com/article/187425/gop-polls-rigging-averages-trump ; This is a bit of an overstatement not all polling averages are equal. For example, The Washington Post, only uses highly rated pollsters. https://www.washingtonpost.com/elections/interactive/2024/presidential-polling-averages/
[xliv] https://x.com/matthewjdowd/status/1850198504544637402
[xlv] https://x.com/matthewjdowd/status/1850203384525083078
[xlvi] https://www.nytimes.com/2024/10/06/upshot/polling-methods-election.html
[xlvii] See note xlvi.
[xlviii] See note xlvi.
[xlix] See note xlvi.
[l] See note xlvi.
[li] See note xlvi.
[lii] https://x.com/rnishimura/status/1846571163465794033
[liii]https://www.msnbc.com/opinion/msnbc-opinion/trump-harris-2024-election-polls-challenges-rcna176467
[liv] https://www.youtube.com/shorts/lKw7CvL3D9Y (Pew Research Short on Weighting)
[lv] See note liv.
[lvi] Silver, Nate. New York Times Polls Are Betting on a Political Realignment. Silver Bulletin. Email Newsletter on October 12, 2024.
[lvii] https://abcnews.go.com/538/read-political-polls-2024/story?id=113560546
[lviii] https://aapor.org/wp-content/uploads/2022/12/Herding-508.pdf
[lix] https://x.com/admcrlsn/status/1849846885042757863 ; https://x.com/mattyglesias/status/1849794210695663735
[lx] https://maristpoll.marist.edu/likely-voter-models-everything-you-ever-wanted-to-know/
[lxi] See note lx.
[lxii] McKown-Dawson, Eli and Silver, Nate. A Mystery in Likely Voter Polls. Silver Bulletin. Email Newsletter on October 24, 2024.
[lxiii] See note lxii.
[lxiv] See note lxii.
[lxv] See note lxii.
[lxvi] See note lxii.
[lxvii] See note lxii.
[lxviii] See not lx and lxii.
[lxix] https://www.foxnews.com/official-polls/fox-news-poll-trump-ahead-harris-2-points-nationally
[lxx] https://www.theguardian.com/us-news/2024/sep/23/polls-undercounting-trump-support
[lxxi] https://www.foxnews.com/politics/trump-support-among-young-black-latino-men-spikes-new-poll
[lxxii] https://www.yahoo.com/news/trump-makes-big-bet-low-175717132.html ; https://www.washingtonpost.com/politics/2021/04/02/2016-trump-activated-low-turnout-whites-2020-he-may-have-done-same-with-latinos/ ; https://www.cookpolitical.com/analysis/video/first-person/david-wasserman-diverging-paths-highly-vs-peripherally-engaged-voters
[lxxiii] https://www.foxnews.com/official-polls/fox-news-poll-trump-ahead-harris-2-points-nationally
[lxxiv] https://www.youtube.com/watch?v=BzpT138vOIU (Pod Save America, Kamala Harris’ Senior Advisor on Donald Trump and the Polls at 2:14)
[lxxv] https://projects.fivethirtyeight.com/2024-election-forecast/ accessed on 10/28/2024 at 10:10AM
[lxxvi] https://projects.fivethirtyeight.com/2022-election-forecast/senate/
[lxxvii] https://projects.fivethirtyeight.com/2022-election-forecast/governor/
[lxxviii] See note lxxvi.
[lxxix] See notes lxxvi and lxxvii.
[lxxx] https://youtu.be/7YsTKE263Ys?feature=shared (Pod Save America, Kamala Harris Outflanks Trump with Conservative Women + He Goes Viral in McDonald’s Photo starting at 31:18)
[lxxxi] See note xlvi.
[lxxxii] https://brieflywriting.com/2012/07/25/the-dog-that-didnt-bark-what-we-can-learn-from-sir-arthur-conan-doyle-about-using-the-absence-of-expected-facts/
[lxxxiii] https://thehill.com/latino/4944585-harris-leads-trump-battleground-latino-voters-poll/
[lxxxiv]https://www.nbcnews.com/politics/2024-election/harris-maintains-strong-lead-black-swing-state-voters-new-poll-rcna175420
[lxxxv]https://www.politico.com/live-updates/2024/10/28/2024-elections-live-coverage-updates-analysis/aarp-survey-00185978
[lxxxvi] https://iop.harvard.edu/youth-poll/latest-poll
[lxxxvii] https://x.com/brianschatz/status/1848888120483500125

